Technology due diligence checklist for private equity: what the standard template misses
Every private equity sponsor runs some form of technology due diligence before close. Almost none of it answers the questions that will determine whether the investment creates or destroys value in the first three years of the hold.
The standard commercial technology assessment covers the obvious ground: does the company have a CTO, is it on the cloud, does it hold a SOC 2 certificate, and what percentage of revenue is spent on IT? These inputs are not useless. They describe what the technology looks like today. Sponsors need to know what the technology will cost to maintain, adapt, and scale under a PE ownership model, typically a 3-to-7-year hold with a trade or secondary exit on the other end. That is a different inquiry, and it demands a different checklist.
In our experience across technology assessments for mid-market and lower-middle-market sponsors, the gap between a passing DD report and a company that actually performs on the technology dimension is consistent and significant. Companies that earn a green-light assessment still produce operational surprises at a high rate. Those surprises are not random. They cluster around a small set of risks that the standard template systematically under-weights.
What the standard template actually measures
Most third-party technology assessments are structured around three implicit questions: is the technology defensible as described in the CIM, are there any obvious catastrophic risks, and does the architecture appear modern? These are reasonable questions for a three-week engagement billed to the sponsor at $150,000 to $250,000. They are not sufficient for a decision at 8 to 12 times EBITDA.
The standard template produces false comfort in three specific areas. First, it conflates vendor-managed infrastructure with operational maturity. A company running entirely on AWS managed services can still have zero incident response process, no disaster recovery testing, and no change management discipline. The cloud provider absorbing infrastructure complexity does not transfer operating discipline to anyone.
Second, the template treats certification as a proxy for security posture. A SOC 2 Type II certificate tells you that an auditor tested a set of controls at a point in time. It does not tell you the age of the underlying systems, the severity of the open findings in the remediation backlog, or whether the controls reflect how software is actually built and deployed day-to-day.
Third, the standard template under-examines the engineering organization as a system. Technology is built and maintained by people in a particular organizational context, and that context is usually more predictive of post-close performance than any technical attribute.
The counter-take we offer
Conventional technology due diligence frames risk as binary: the technology is adequate or it is not. We disagree. The more useful question is not "is this adequate" but "what will it cost to make it adequate for our investment thesis, and does that cost fit the deal model."
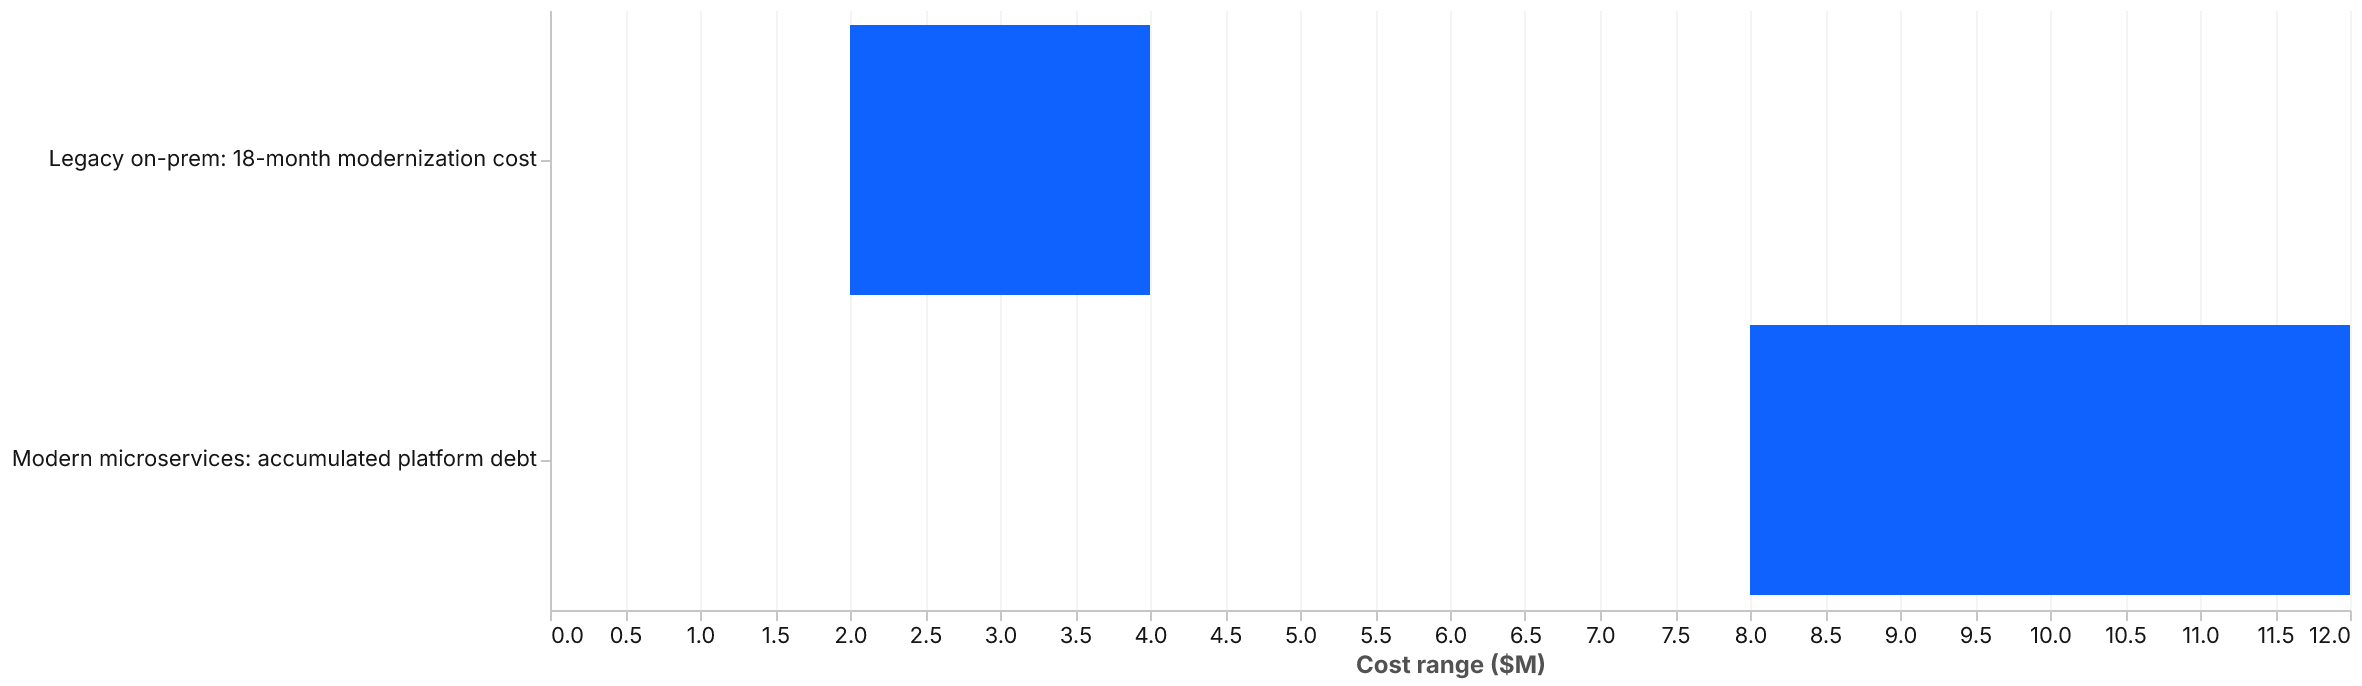
A company with 15-year-old on-premises infrastructure and no cloud footprint is not automatically a bad investment. It may be a company where 18 months of platform modernization at $2M to $4M in engineering cost delivers a real multiple expansion at exit, because the next buyer's diligence will find a clean, modern estate. A company with modern microservices on Kubernetes, by contrast, may carry $8M to $12M in accumulated platform debt that surfaces only after close, because technical choices were made by a team that optimized for deployment speed over operational maintainability.
The question is not whether the technology is modern. It is whether the gap between today's state and the exit-ready state is understood, quantified, and priced into the deal.
The architecture and infrastructure layer
The architecture assessment should produce three outputs that the standard template rarely delivers.
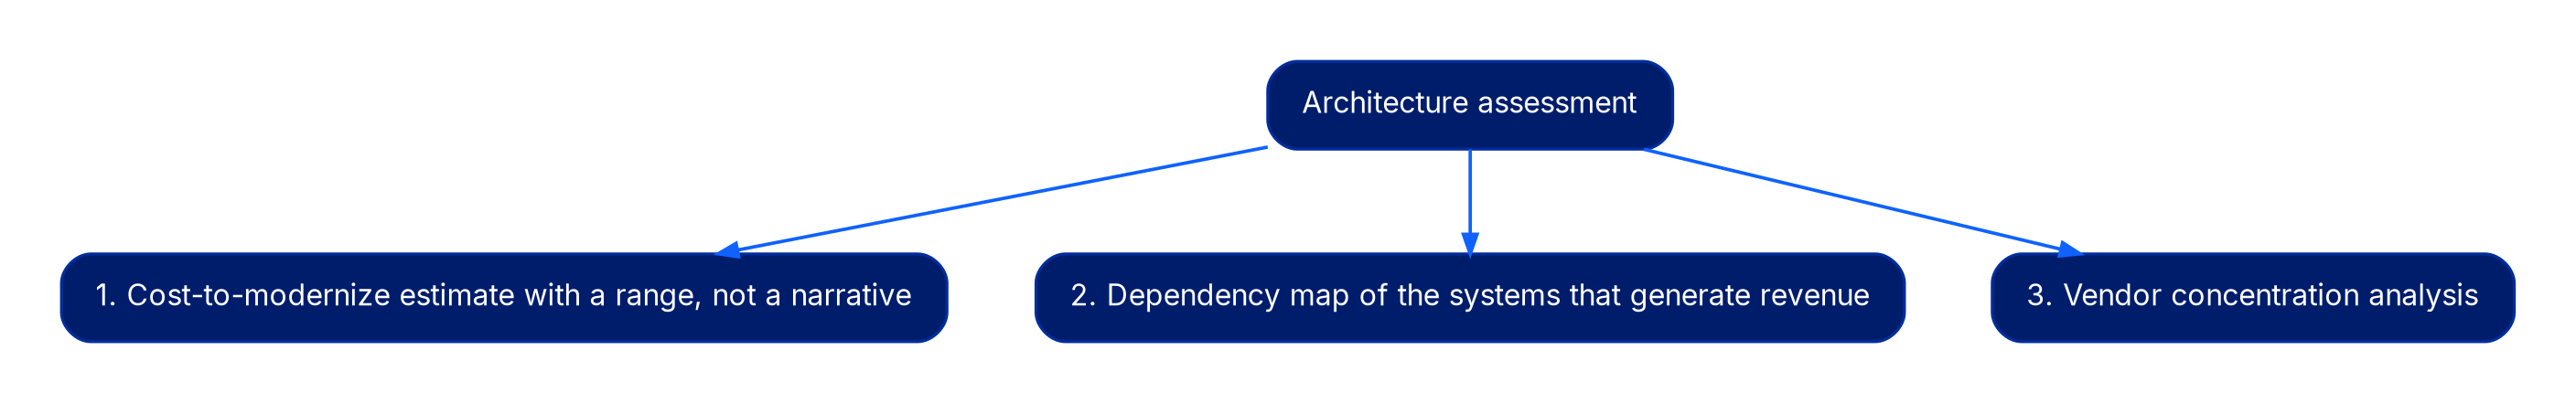
The first is a realistic cost-to-modernize estimate with a range, not a narrative. If the core platform requires re-architecture to support the growth plan in the investment thesis, the sponsor needs a number: we expect modernization to require $2M to $5M over 18 months, consuming 25 to 40% of engineering capacity. Vague language about "technical debt" that does not attach to a cost is not actionable.
The second output is a dependency map of the systems that generate revenue. For a SaaS business, this means the complete path from user request to response: every service, every database, every third-party API call in that path. NIST SP 800-160 provides a rigorous framework for resilience-oriented system analysis; the concepts translate directly to commercial due diligence even though the document is written for federal systems.
The third output is a vendor concentration analysis. Over-reliance on a single infrastructure provider, a single SaaS vendor, or a single integration partner creates exit risk that is invisible in the income statement until it materializes. We have found that single-vendor IT services contracts are frequently priced 30 to 40 percent above market, often with auto-renewal clauses that outlast the planned hold period. That gap belongs in the EBITDA bridge, not in a footnote.
The security and compliance layer
Security due diligence has become more consequential as sponsors have moved into businesses holding regulated data. A single material breach can consume the full-year EBITDA of the business in response and remediation costs alone. IBM's 2024 Cost of a Data Breach report places the average total cost at $4.88 million globally. For businesses in healthcare, financial services, or companies that hold personally identifiable information at scale, that figure is materially higher, and it does not include the secondary costs of regulatory penalty, litigation, and customer attrition.
The security assessment should start from the attack surface, not from the compliance checklist. What systems face the internet, how are they authenticated, when were the dependencies last updated, and how quickly has the team historically identified and remediated vulnerabilities?
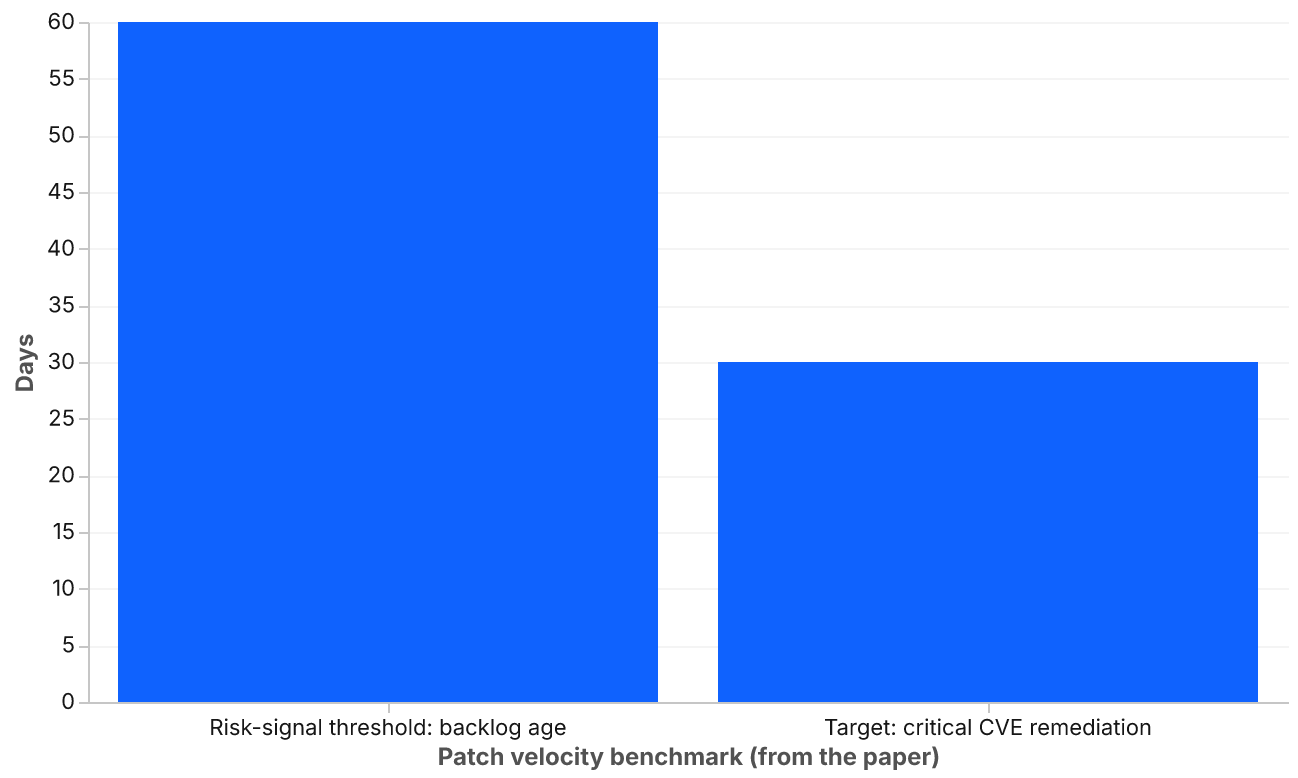
We focus on three indicators that consistently separate resilient security postures from compliant-on-paper ones. Mean time to detect: a company that does not measure it has no empirical basis for claiming it would know about a breach. Patch velocity on the highest-severity CVEs: critical vulnerabilities should be remediated within 30 days; backlogs above 60 days at criticality are a material risk signal. The third is whether the company has run a tabletop incident exercise at the executive level within the past 12 months. CISA's tabletop exercise packages provide a useful benchmark for what a credible exercise looks like. A company that has never run one has not tested whether its incident plan is real.
The engineering organization
The talent assessment is where the standard template does the least work. A skills matrix and org chart do not tell you whether the engineering organization can execute the post-close roadmap. The questions that do are specific.
How concentrated is institutional knowledge? A company where three engineers hold the context for 70 percent of the production codebase carries a key-person risk that will surface at the worst possible time. We examine commit history, on-call rotation distribution, and documentation quality as proxies for knowledge distribution. Concentration is fixable; unrecognized concentration is not.
What is the real capacity utilization? Engineering teams in PE-backed companies often run at 90 to 100 percent on keep-the-lights-on work, leaving almost nothing for the strategic initiatives that the thesis depends on. A growth thesis requiring three new product modules in 18 months needs to price in incremental engineering capacity, not assume it comes free from a team already fully committed.
What is the attrition history, and where does compensation sit relative to market? Attrition above 20 percent annually is an operational risk. Compensation packages more than 15 percent below market create a retention exposure that accelerates post-close, exactly when the team is most exposed to recruiter outreach. The compression is often obscured by options or phantom equity structured at a prior valuation; the assessment team should model the cost of repricing to market in the EBITDA bridge.
Integration and exit readiness
The final layer the standard template under-serves is integration and exit readiness. PE sponsors have two kinds of exits: trade sales and secondary transactions. Both buyer types run their own technology diligence. The question for the incoming sponsor is not only "what is the technology risk today" but "what will the next diligence team find, and how do we want to shape that."
Platform add-on strategies carry a specific version of this problem. Each add-on arrives with its own technology estate, its own data model, and its own vendor relationships. Companies that complete two or three add-ons in a five-year hold without a deliberate integration architecture typically arrive at exit with a fragmented estate. That description will appear in the buyer's diligence report and will appear again in the pricing.
The pre-close assessment should model the integration cost for each likely add-on at high level. Not a detailed specification, but a credible order-of-magnitude estimate: what will it cost to integrate a company in this vertical, of this size, onto our platform? A range of $500K to $2M per integration is common for mid-market add-ons. Deals where the figure is materially higher should trigger a platform architecture review before the first add-on closes.
Where to use these findings
The outputs of a rigorous technology assessment have three uses. First, they are deal-pricing inputs: quantified technical debt and modernization cost should inform the entry multiple or the equity structure. Second, they form the foundation of the 100-day plan: the assessment should produce a prioritized initiative list that the incoming management team can act on in the first quarter without waiting for another study. Third, the assessment process itself is a management evaluation. The quality of the target's technology leadership preparation, the accuracy of their self-assessment, and the credibility of their roadmap are signals about the team the sponsor is backing.
Technology due diligence done well is not a risk screen. It is a value-creation planning tool. The difference between those two orientations is not the checklist; it is the question the sponsor brings to the table.
Before you close
- Confirm that the assessment produced a cost-to-modernize estimate with a dollar range and timeline, not a narrative description.
- Validate security posture through mean time to detect and patch velocity data, not certification history alone.
- Map institutional knowledge concentration and model the cost of losing the top three knowledge holders.
- Build a compensation-to-market analysis for the engineering team and include any required adjustment in the EBITDA bridge.
- Model integration costs for likely add-on acquisitions before the platform deal closes.
- Treat the technology leadership's response to the assessment as a direct input to the management evaluation.
- Ask the assessment team to define the conditions under which their findings would change the deal structure, not merely whether the technology is adequate.
Continue reading
Building an Internal Developer Platform Your Engineers Will Use
Internal developer platforms are having a moment. Backstage adoption is up, "platform engineering" is the title du jour, and most large enterprises no…
Fractional CTO vs. Interim CTO: Knowing When Each Model Fits
Here is a pattern we see constantly. A B2B SaaS company loses its CTO to a competitor. The board, watching burn rate, decides a fractional CTO is the …