
01 / TCO
Multi-cloud TCO
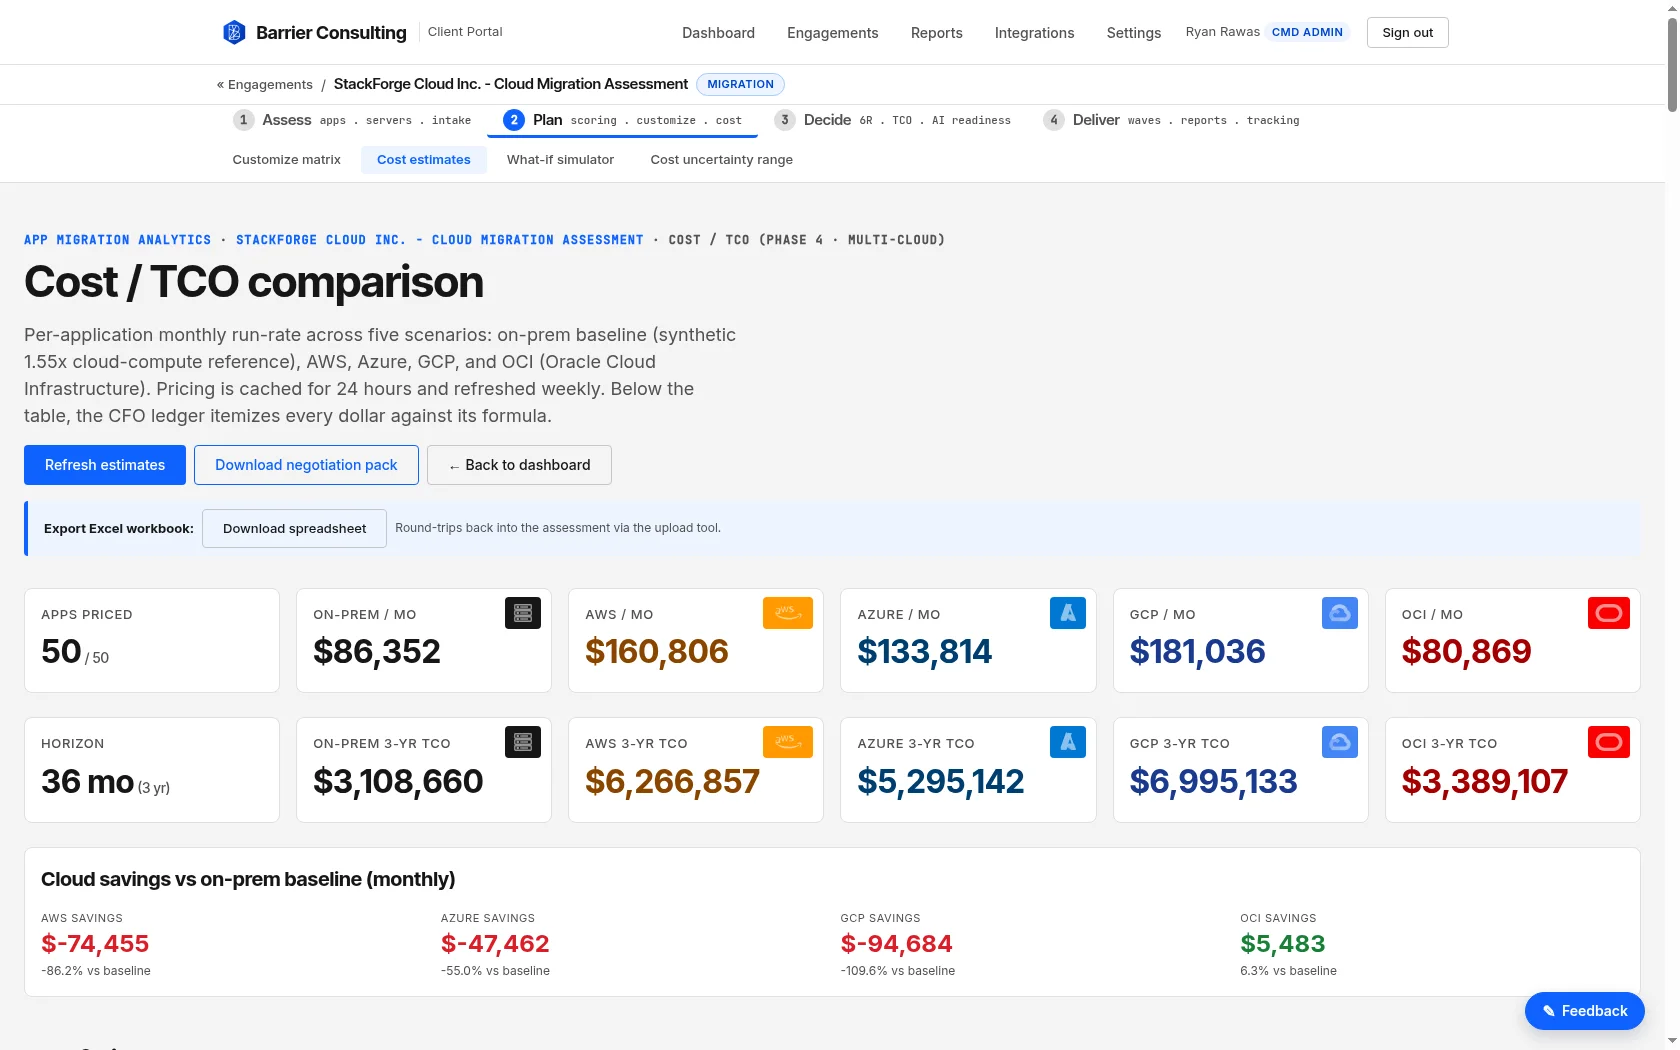

AWS, Azure, GCP, OCI, and on-prem comparison with itemized run-rate, migration cost, and decommission savings. Every dollar traceable to a formula.

Built vendor-neutral. Delivered inside Barrier engagements.
Real screens from a live assessment - multi-cloud TCO, the dependency graph, and a computed wave plan - the same output we hand you inside an engagement.
Multi-cloud TCO, dependency mapping, wave planning. Used in every Barrier engagement.
AWS, Azure, GCP, OCI, and on-prem comparison with itemized run-rate, migration cost, and decommission savings. Every dollar traceable to a formula.
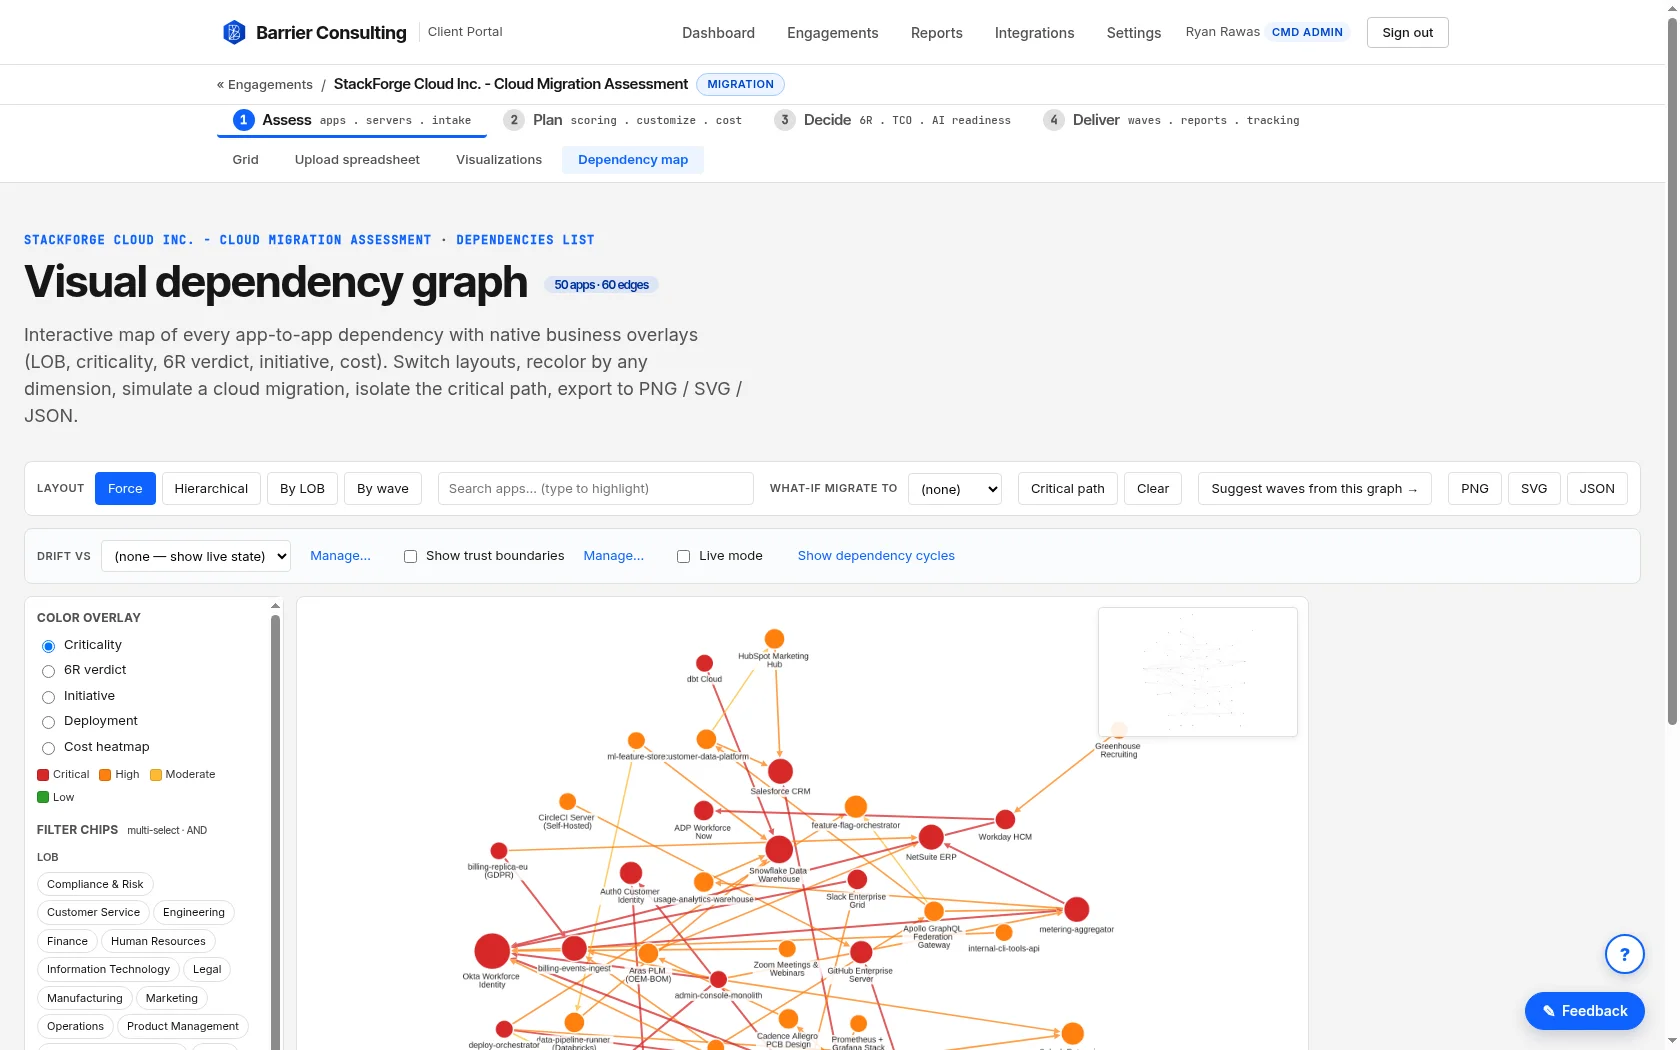
Interactive graph with business overlays (criticality, 6R, initiative band, cost), what-if migration simulation, AI narrative explanation, drift mode, and trust-boundary overlays.
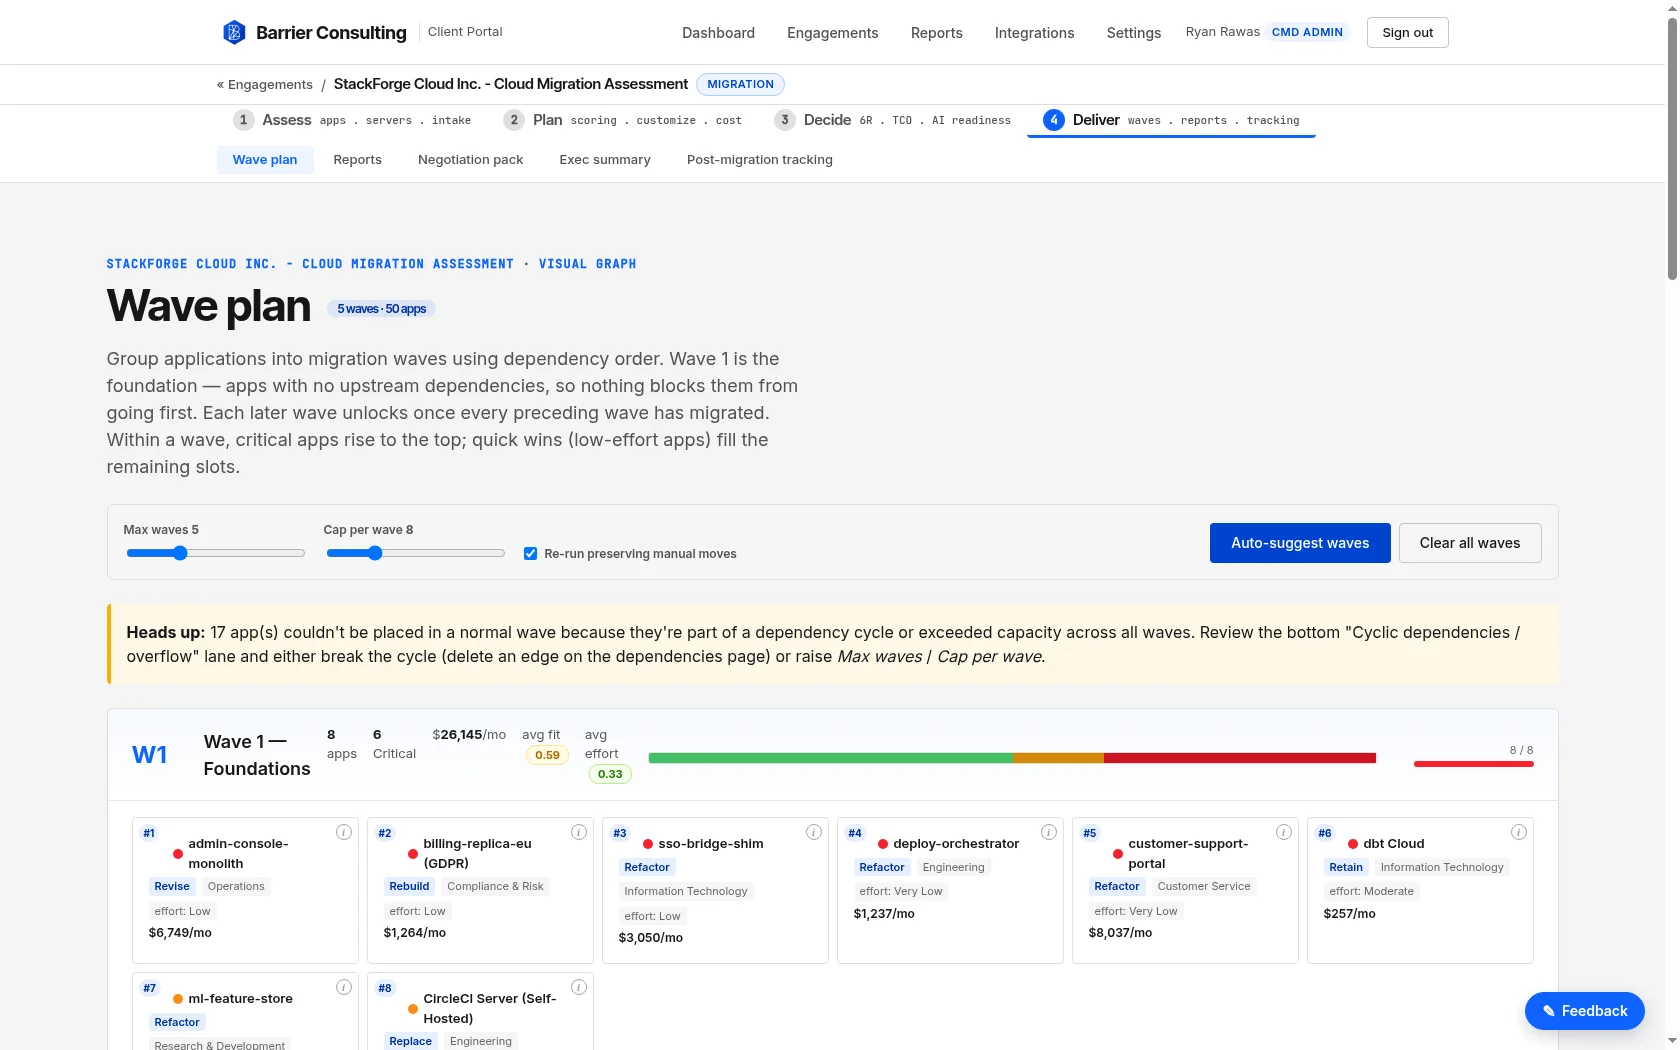
Topological dependency-ordered migration waves with capacity caps, cycle detection, and within-wave priority by criticality + effort + fan-out. Drag-and-drop adjustments preserved across re-runs.
Every screen below is the live tool, run on a 50-application sample portfolio. The same workflow scales from a 50-app carve-out to a 5,000-app migration.
Per-application monthly run-rate and 3-year TCO across AWS, Azure, GCP, OCI and on-prem - priced from live AWS and Azure rate cards, cached and refreshed weekly. A CFO ledger itemizes every number against its formula, and the whole model round-trips to Excel.
An interactive app-to-app map with business overlays - criticality, 6R verdict, initiative band, cost. Switch layouts, recolor by any dimension, simulate a what-if migration, isolate the critical path, and export to PNG, SVG, or JSON.
Topological, dependency-ordered waves with capacity caps and cycle detection. Foundation apps go first; the critical core lands last and is flagged as the schedule risk. Cyclic or over-capacity apps are surfaced instead of silently mis-sequenced, and manual drag-and-drop moves survive a re-run.
The before-and-after, a portfolio value map, and a looping recap. Sample data is illustrative; the format is what lands in the report.
One vendor-neutral platform replaces scattered spreadsheets, discovery scripts, and slideware - across all four engagement scenarios.
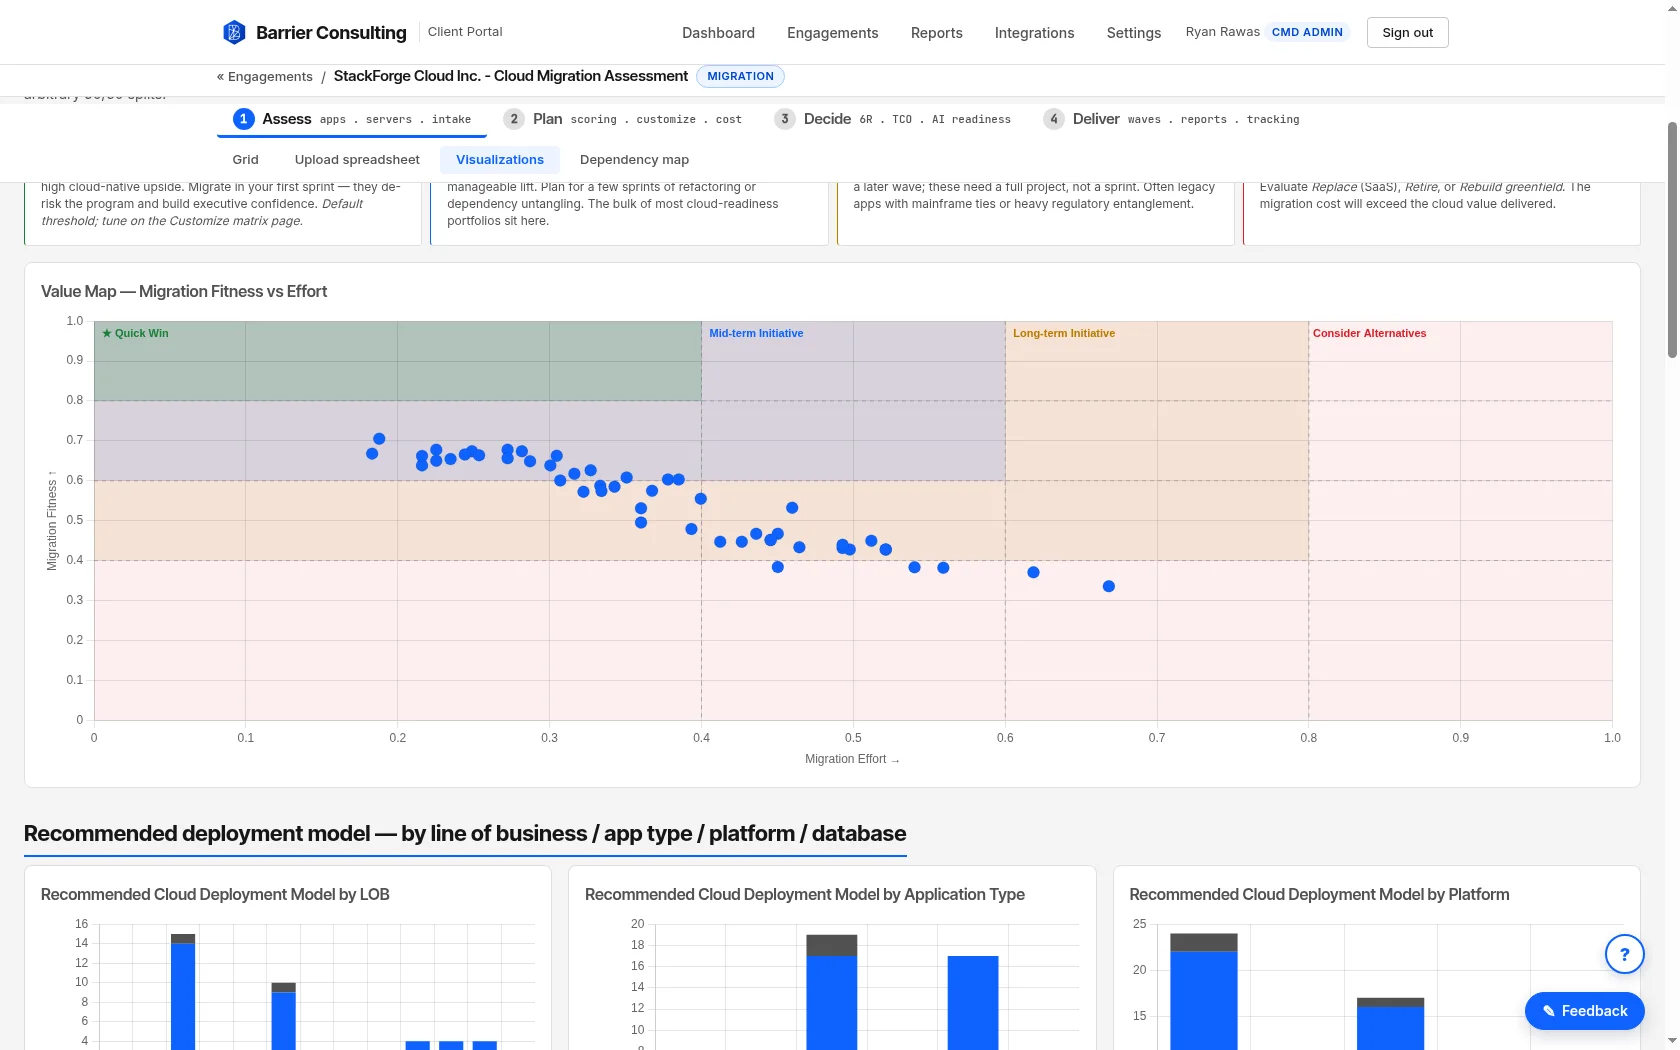
Every application plotted by migration fitness against effort, auto-bucketed into Quick Win, Mid-term, Long-term, and Consider-alternatives.
A short looping recap of how a fragmented, multi-month assessment collapses into a single structured run.
Migration is the most common destination but not the only one. The same questionnaire, dependency graph, and cost engine answer four distinct engagement types.
Move from on-prem (or co-lo, or hosted) to a public cloud. Multi-cloud cost modeling, dependency-ordered wave plan, 6R disposition per app.
Already in AWS or Azure? The same engine compares all four clouds. Includes egress and re-architecture costs.
For orgs already cloud-native: which apps to keep, kill, modernize, or replace. Same 6R framework, no migration required. Most common follow-up to a cost overrun.
IT portfolio diligence pre-deal, separation planning during integration, post-merger rationalization. Fortune 500 carve-out case study below.
Gartner classifies the underlying capability as Application Discovery and Dependency Mapping (ADDM), a $4B+ market. Barrier delivers it inside the Public Cloud IT Transformation Services engagement model.
Those are FinOps tools for ongoing cloud spend management once you are already in cloud. Cloud Intelligence is an assessment platform for migration, arbitrage, rationalization, and M&A diligence, the work that happens before workloads move (or before they get cut). Different buyer, different workflow, different output (a wave plan and a defensible TCO model, not a monthly chargeback report).
We sit alongside, and we are explicitly neutral. AWS Transform shipped September 2025 and optimizes for AWS landing zones. Azure Copilot Migration Agent shipped the same month and optimizes for Azure. Both are useful inside their respective clouds. Neither will tell you to pick the other. Cloud Intelligence scores AWS, Azure, GCP, and OCI on the same matrix, weighted by your scenario, we have no landing-zone quota.
CSV import works today and is the path most engagements use. ServiceNow and Device42 connectors are on the roadmap. The XLSX round-trip with the v5.1 Excel template covers the cases where your client gives you a spreadsheet and wants the answer back in the same format.
Each engagement runs in its own isolated workspace. The database itself refuses to return one client’s data to a different client’s session, this is enforced at the database layer, not just in the application code, so even a software bug cannot leak data across engagements.
Specifically:
Need to hand this answer to your security team for review? Get the long-form security brief.
Yes. Branded PDF report, CSV of every table, XLSX round-trip with the v5.1 Excel template, and REST API. Your assessment outputs are yours; we never gate the export.
Scope is set per engagement, not per tier. There is no hardcoded app or server cap. Whether the engagement covers 50 apps for a mid-market carve-out or 5,000 apps for a Fortune 500 multi-year migration, the tool runs at the size of the work. The shape of the engagement is something we agree before we start; talk to us about the assessment in front of you.
To see it run on your migration, arbitrage, rationalization, or M&A engagement, get in touch.