FinOps maturity model self-assessment: why most organizations score themselves wrong
Almost every engineering organization with meaningful cloud spend has heard of the FinOps Foundation maturity model. Fewer than 20 percent of the teams that claim Run-stage behavior actually demonstrate it when we look at their practices. That gap exists not because people are dishonest but because the criteria invite wishful reading.
We have run these assessments enough times to say plainly: the self-assessment instrument is the problem, not the teams.
The FinOps Foundation's Crawl, Walk, Run maturity framework describes three stages of cloud financial management capability across six practice domains. The framework itself holds up. What does not hold up is how most organizations apply it to themselves. The criteria are written at enough abstraction that a Walk-stage team can, in good faith, interpret them as Run. We have seen this across financial services, SaaS, and retail infrastructure. The inflated score gets baked into the roadmap, the roadmap stalls for lack of the right next step, and the organization keeps spending 25 to 35 percent more than a genuinely mature program would.
This paper is a field guide for doing the assessment with evidence rather than optimism.
Why self-reported maturity scores skew high
Take the Run-stage description from the official framework: "Goals and KPIs are defined and measured. Automation is used to reduce manual effort. Cost is considered in architectural decision-making." A Walk-stage team reads that and checks the box. They have KPIs. They have some automation. Cost comes up in architecture review. Box checked.
What the description actually requires is something harder.
Run-stage KPIs are unit-cost metrics tied to business outcomes. Cost per active user, cost per transaction, cost per gigabyte processed. If your FinOps reporting surfaces total spend by service or account rather than cost per unit of value delivered, that is Walk-stage reporting, full stop. The distinction matters enormously when you try to hold an engineering team accountable to a number: account-level costs are not something any individual team can directly move.
Automation has the same gap. Walk-stage teams have automated their cost reports and their anomaly alerts. Run-stage teams have automated the response to anomalies, not just the detection. An alert that fires into a Slack channel where nobody owns it is not automated management. The human bottleneck is still there; only the paper trail has changed.
Then there is culture, which the framework mentions and which teams almost universally overcount. At Run stage, engineers raise cost implications in architecture review without being prompted. That requires cost data to live where engineers already work, not in a finance dashboard that nobody opens between budget cycles. Where we have seen the culture criterion genuinely satisfied, an engineering leader made cost a first-class concern in their team's operational vocabulary. It did not come from the FinOps function alone.
The incentive to score upward is real. The criteria are abstract enough to support it. And nobody gains anything from the lower score. So scores trend high, problems stay invisible, and teams wonder why maturity never seems to improve despite continued investment.
The maturity model and what it actually demands
The FinOps Foundation framework covers six domains: Understand Cloud Usage and Cost, Quantify Business Value, Optimize Cloud Usage and Rate, Manage the FinOps Practice, Establish FinOps Culture, and Automate and Scale. Each domain has its own Crawl/Walk/Run criteria, and they do not average together cleanly.
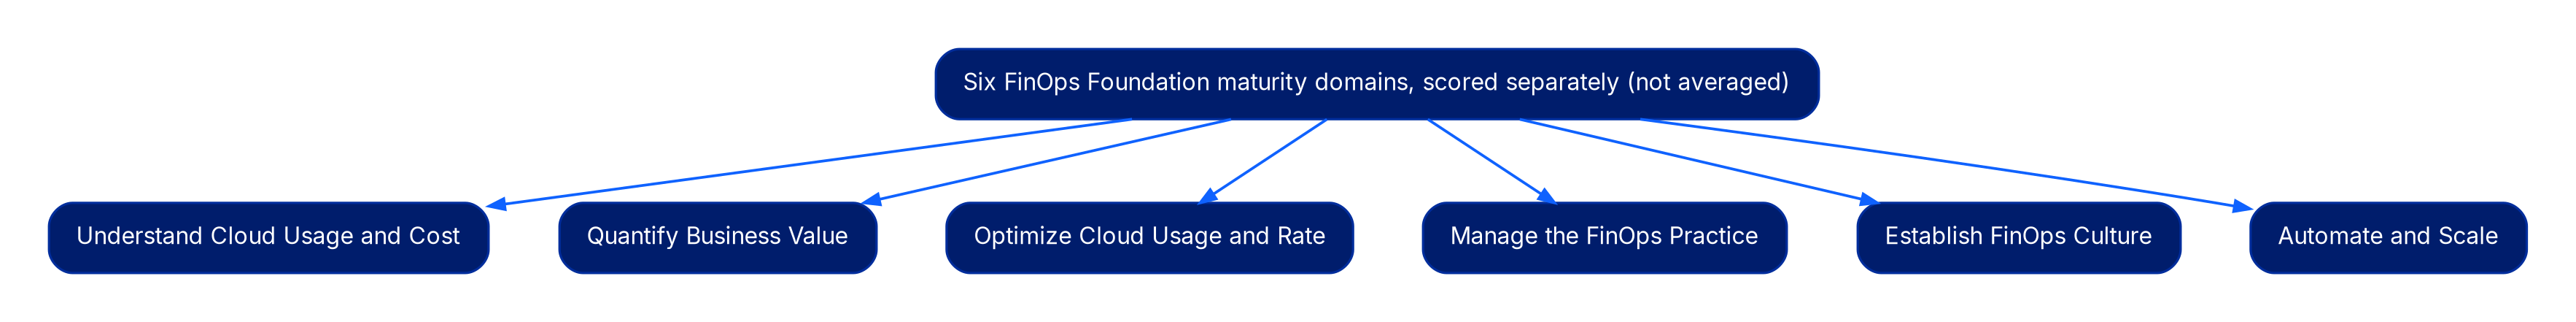
This is where the second common error shows up. Organizations treat the model as a single composite score when it is a domain-by-domain profile. An organization that is Run in Optimize Cloud Usage and Rate and Crawl in Quantify Business Value is not a Run organization. It is a billing team that has mastered commitment discounts without being able to say whether the workloads those discounts cover generate proportionate business value. That is a common profile and a genuinely dangerous one.
Flexera's State of the Cloud Report consistently puts cloud waste at around 27 percent across surveyed organizations, including enterprises that describe their FinOps practice as mature. The number has barely moved over several years of reporting. Identification of waste is improving. Prevention is not. That asymmetry maps directly onto the maturity curve: identifying waste is a Crawl-to-Walk problem that tooling solves reasonably well. Preventing waste from accumulating in the first place requires engineers to price cost into architectural decisions before the resources exist. That is a Walk-to-Run problem, and no dashboard solves it on its own.
Five diagnostic questions that reveal where you actually are
Our recommendation is to skip the abstract criteria entirely for the initial calibration and answer five concrete questions instead. Each one has an evidence requirement. Opinions do not count.
Can you produce a cost-per-unit-of-business-activity metric for your three largest workloads? This single question separates Walk from Run more reliably than any other. Cost per request, cost per monthly active user, cost per GB ingested. If the number does not exist for your three biggest workloads, the score is Walk regardless of everything else the practice has achieved.
What is the median time from anomaly detection to a human decision? Under 4 hours is consistent with Run. Four to 24 hours is Walk. Beyond that, or any answer that includes "it depends on who is on call," is Crawl. Note that this is time-to-decision, not time-to-alert. Detection latency is mostly a tooling problem; decision latency is an accountability and process problem.
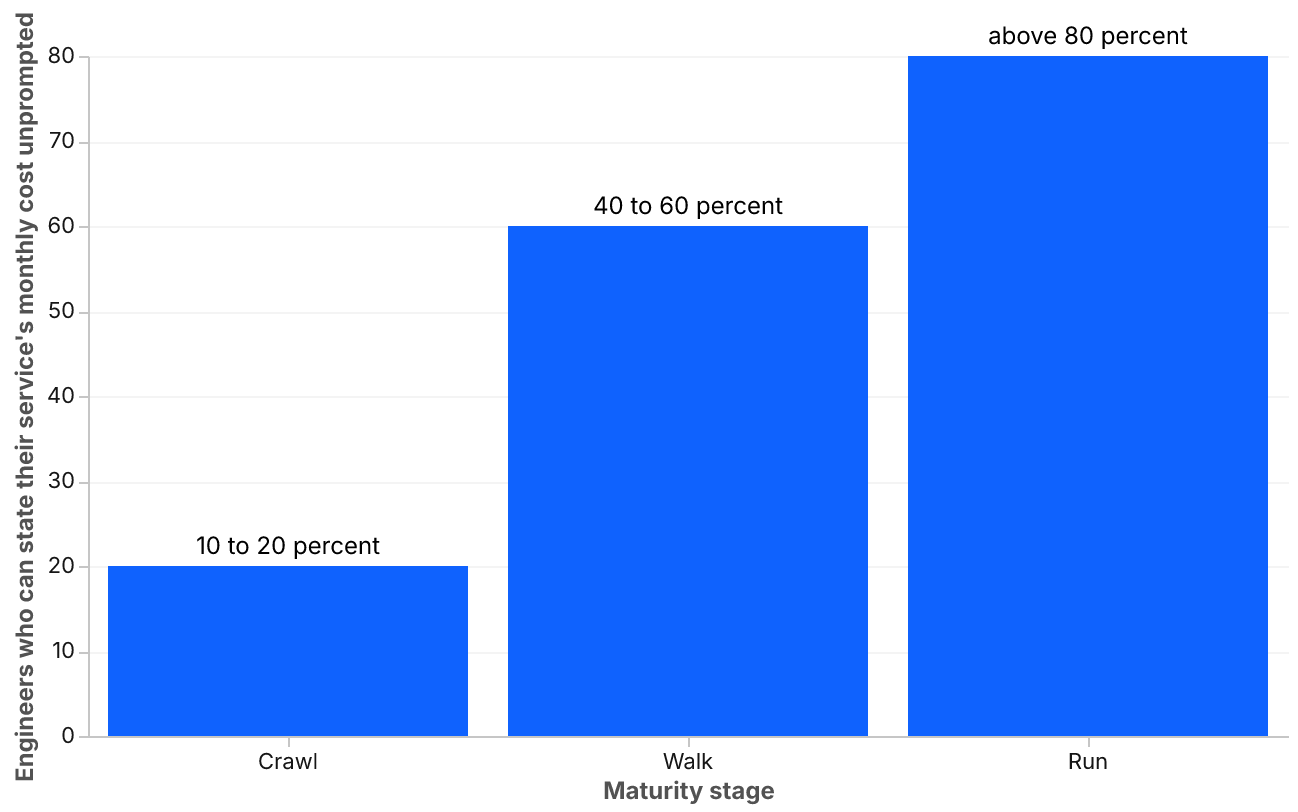
What fraction of your engineers can state the monthly cost of their service without looking it up? We ask this question in architecture reviews. The numbers are consistent: roughly 10 to 20 percent at Crawl organizations, 40 to 60 percent at Walk, above 80 percent at Run. If your organization has not asked this question before, assume the Crawl range.
Does your architecture review process include a cost-impact checkpoint with a written escalation threshold? The threshold does not need to be precise. It needs to exist. "Any change adding more than $5,000 in monthly spend requires a FinOps sign-off" is a threshold. "We consider cost in design" is not. The presence of a written number is itself a signal about where the practice sits on the curve.
Are cloud commitments reviewed on a monthly cadence? Reserved instances, savings plans, and committed-use discounts across AWS, Azure, and GCP carry different flexibility profiles and expiration windows. Quarterly review is Walk. Monthly review is Run-stage minimum. Annual or ad hoc review is Crawl, and the probability of leaving 15 to 25 percent of savings-plan potential on the table is high.
Write down your answers to all five before continuing. The pattern across the five will locate you more accurately than a full formal assessment.
The gaps that separate walk-stage from run-stage
Walk and Run organizations often carry similar tooling stacks. Both have cloud cost management platforms, both have tagging policies, both have anomaly alerting. The gap shows up in three structural differences, not product differences.
The first is whether cost data has been embedded into engineering workflows or kept separate in a finance-facing tool. At Run-stage organizations, the unit-cost metric appears alongside p99 latency and error rate. The on-call engineer sees a cost anomaly with the same visual weight as a latency spike. That is not a FinOps dashboard change. It is an observability philosophy change that requires an engineering leader to decide that cost is a property of the system, not a report from another department. We have not once seen that shift come from the FinOps team pushing dashboards. It comes from engineering leadership pulling cost data into their own operating review.
Second is the level at which accountability sits. Account-level cost data tells you which environment spends what. Product-level cost data tells you which business capability costs what per unit of value. In our work, engineering teams that switch from account-level to product-level accountability typically reduce their cost footprint by 20 to 30 percent within 90 days. No new tooling, no architectural change. The framing change is what moves behavior.
Third is how the organization treats commitment management. AWS, Azure, and GCP all reward longer commitments with discounts of 40 to 66 percent below on-demand rates. Run-stage organizations treat this as a continuous engineering practice with a monthly cadence. Walk-stage organizations treat it as a procurement event that happens once a year and produces a commitment set that is already partially wrong by month three.
The counter-take we offer here is one most FinOps vendors will not: the Walk-to-Run transition is not a tooling problem. We have seen organizations with best-in-class platforms stuck at Walk for two and three years. We have seen organizations with spreadsheets and Slack alerts running at Run-stage behavior. The constraint is accountability structure and cultural norms, not the product. Tooling accelerates a practice that already has the right ownership model. It cannot substitute for that model.
How to run a credible self-assessment in two weeks
You do not need a consulting engagement to get a defensible answer. You need structured evidence collection across the six framework domains and one person who owns the output.
One owner is the prerequisite. Not a steering committee, not a cross-functional working group. Committees produce consensus scores; consensus scores overstate maturity by design. Assign one person to collect evidence and call the scores, with authority to say the number is lower than the team believes.
For each of the six domains, list the three to five specific claims your organization would make about its maturity stage. Then identify the artifact that supports or refutes each claim. Reports, dashboard screenshots, anomaly response logs, commitment utilization exports, architecture review notes with cost checkpoints. If the artifact does not exist, write "no evidence" and count that as a finding. It often is the most important finding in the entire assessment.
Score the domains separately. Resist converting six scores into one composite. A radar chart with six distinct readings is more useful than any average, because the shape of the gaps tells you where to invest. Two organizations at the same average score can need completely different next steps depending on which domains pulled the average down.
Then spot-check two of the five diagnostic questions with actual data. If your team scored Run on anomaly response but cannot produce a log of the last ten anomalies with timestamps for detection and human decision, that score does not hold.
When presenting results, bring the FinOps lead and the head of engineering into the same room. The cost-culture and automation domains are engineering ownership problems. Finance alone cannot fix them.
Where to take the results
The assessment produces a domain profile, not a project plan. Turning it into one requires four additional decisions.
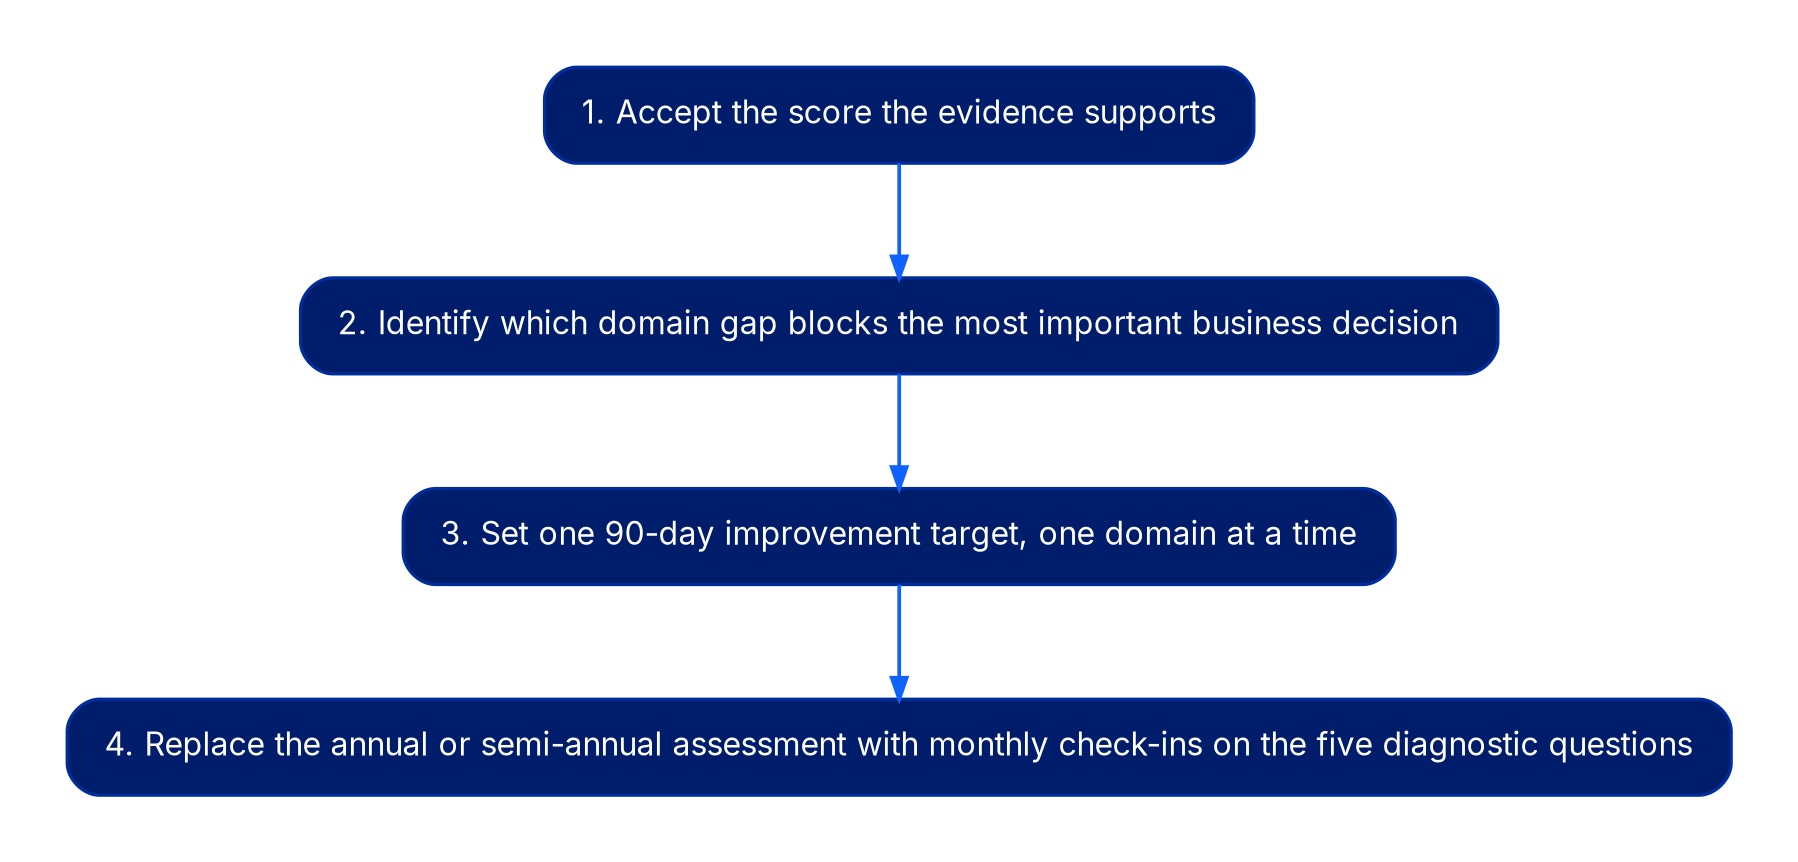
First, accept the score the evidence supports. An accurate Walk score is operationally more valuable than an inflated Run score because it identifies the actual constraint. Teams that inflate their scores tend to invest in Run-stage tooling when their organization needs Walk-stage accountability infrastructure.
Second, identify which domain gap is blocking the most important business decision your organization needs to make. Missing unit-cost metrics means engineering leadership cannot make architecture tradeoffs with cost data in hand. Fix that before refining commitment posture further. Work on the bottleneck, not the activity nearest the tooling budget.
Third, set one 90-day improvement target, one domain at a time. Trying to advance across all six simultaneously is precisely how FinOps programs lose momentum and funding. Pick the domain with the clearest business impact, define the specific evidence that would confirm progress to the next stage, and name one owner accountable for producing that evidence.
Fourth, replace the annual or semi-annual full assessment with monthly check-ins on the five diagnostic questions. The diagnostic questions are leading indicators; the full maturity assessment is a lagging one. Monthly diagnostic check-ins will surface regression and progress faster than waiting for the next formal cycle.
Commitment utilization belongs in the monthly engineering operating review by default. The organizations we have worked with that maintain that cadence consistently capture 15 to 20 percentage points more of their available savings-plan discount than peers at the same nominal maturity level. The advantage is not tooling. It is the forcing function that a standing monthly agenda item creates.
Continue reading
AWS to Azure Migration Cost Benchmarks: What the Numbers Actually Show
Most AWS-to-Azure migration budgets are wrong before the project starts. Not because the engineers are bad at their jobs. They are wrong because the c…
Multi-Cloud Without the Theater: Where Portability Actually Pays
Multi-cloud is one of the most overprescribed strategies in enterprise architecture. The idea sounds prudent, the slide builds itself, and the cost fa…
Cloud Cost Discipline: A 30/60/90 Plan for Mid-Market Buyers
Most mid-market cloud bills are 25 to 40 percent inefficient. A focused ninety-day plan to recover that spend without a refactor.Cloud cost optimizati…