

Cloud Carbon Accounting: Why the Vendor Dashboard Won't Survive Your Audit
Almost every enterprise on a hyperscaler now has a cloud carbon number. Few have one that an auditor will accept. The provider dashboards make the first part easy and the second part nearly impossible, and the gap between those two facts is where most sustainability reporting programs quietly break.
The forcing function is regulation. The EU Corporate Sustainability Reporting Directive pulls a large population of companies into mandatory, audited disclosure under the European Sustainability Reporting Standards, with climate covered by the standard known as ESRS E1. The key word is audited. A sustainability number that was once a marketing line in a glossy report now sits next to the financials, carries assurance, and has to reconcile. Cloud emissions land squarely inside that scope for any company whose IT estate has moved off premises, and that is most of them.
The number on the dashboard is not the number your auditor wants
Every major provider ships a carbon tool. AWS has the Customer Carbon Footprint Tool, Google Cloud has Carbon Footprint, and Microsoft has the Emissions Impact Dashboard. Each gives you a tidy figure, usually trending down, often close to zero for the compute you run. The first instinct of a reporting team under deadline is to copy that figure into the disclosure and move on.
We tell clients to stop before they do that, for three reasons.
First, the granularity is wrong for accounting. The AWS tool, for example, publishes data with roughly a three-month lag and at monthly resolution, which is fine for a trend line and useless for tying an emission to a workload, a business unit, or a reporting boundary. Second, the methodology is the provider's, not yours, and it is not transparent enough to defend line by line under assurance. Third, and most important, the number you are handed is a market-based number, and market-based is the figure that flatters the cloud the most.
Why market-based reporting flatters the cloud
The distinction between market-based and location-based accounting is the single most consequential thing a reporting team needs to understand here, and most learn it the hard way. The GHG Protocol Scope 2 Guidance requires dual reporting: a location-based figure that reflects the physical grid your electricity actually came from, and a market-based figure that reflects the contractual instruments you bought, such as renewable energy certificates and power purchase agreements.
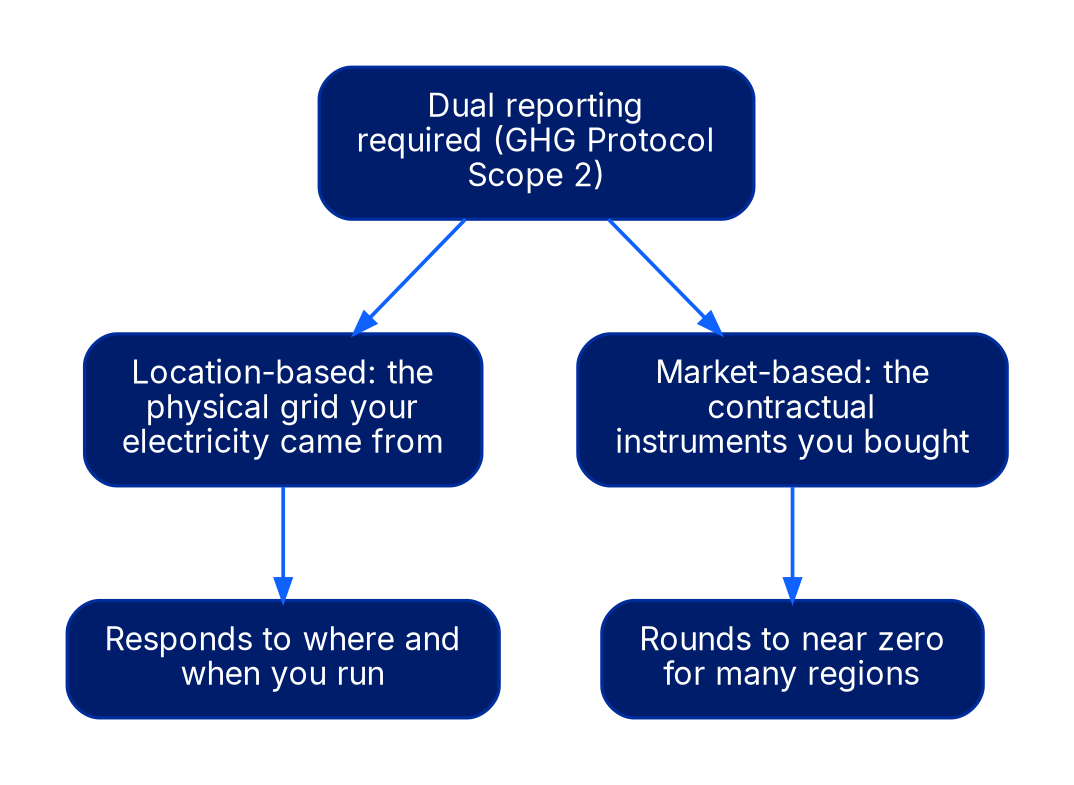
Hyperscalers buy those instruments at enormous scale. Their market-based emissions for many regions round to near zero, because on paper the energy is matched to renewable purchases. The location-based emissions, the ones tied to the kilowatt-hours that physically spun on a grid that was burning gas at 2 AM, can be an order of magnitude higher. Grid carbon intensity ranges from under 50 grams of CO2 per kilowatt-hour in a hydro-heavy or nuclear-heavy region to over 600 grams in a coal-heavy one. A workload moved from the first region to the second has the same market-based footprint of roughly zero and a wildly different real one.
For an engineering decision, the location-based number is the one that matters, because it is the only one that responds to where and when you run. For a disclosure, you owe both, and the market-based figure cannot stand alone. A reporting team that lifts the near-zero provider number into ESRS E1 without the location-based counterpart has filed an incomplete return, and the assurance provider will say so.
What CSRD actually asks for
ESRS E1 does not ask for a vibe. It asks for gross Scope 1, Scope 2 (both location-based and market-based), and material Scope 3 emissions, with the methodology, boundaries, and significant assumptions disclosed and consistent year over year. For the cloud customer, the provider's electricity sits in your Scope 3, specifically the category for purchased goods and services, because you do not own the data center. That single fact reframes the whole exercise.
It means cloud carbon is not a footnote; for a digital-native business it can be one of the larger lines in the Scope 3 inventory. It also means the GHG Protocol Corporate Value Chain (Scope 3) Standard governs how you bound and calculate it, not the provider's internal model. And it means the data quality requirement is real: under assurance you have to show where each number came from, why the boundary is drawn where it is, and how you would reproduce it next year. A screenshot of a dashboard that recalculates silently when the vendor updates its methodology fails all three tests.
A counter-take: stop chasing the provider number, build your own
Conventional advice says to wait for the providers to improve their tools, then report what they give you. We disagree, and we tell clients the opposite.
The counter-take we offer is this: treat the provider dashboard as one input, not the answer, and build a parallel cloud carbon model you actually control. The inputs you need are available. You already have detailed billing and usage data down to the resource and the hour. Public grid carbon intensity for every cloud region is available from sources like Electricity Maps and the open datasets that providers themselves publish. The conversion from compute hours to energy to emissions is arithmetic once you fix a method.
The reason to own the model is not distrust of the vendor. It is that a model you built is a model you can explain, reconcile, and defend, and those three verbs are what assurance is made of. When the auditor asks why the figure changed, "we shifted batch jobs to a cleaner region and here is the before and after" is an answer. "The dashboard updated" is not. The Software Carbon Intensity specification, now standardized as ISO/IEC 21031:2024, gives you a method to express emissions per unit of useful work, which turns a static annual total into a metric engineers can actually move.
The engineering lever the dashboards hide
Here is the part the vendor tools obscure by design: cloud carbon is highly controllable, and the controls are the same ones that control cost. Three levers do most of the work.
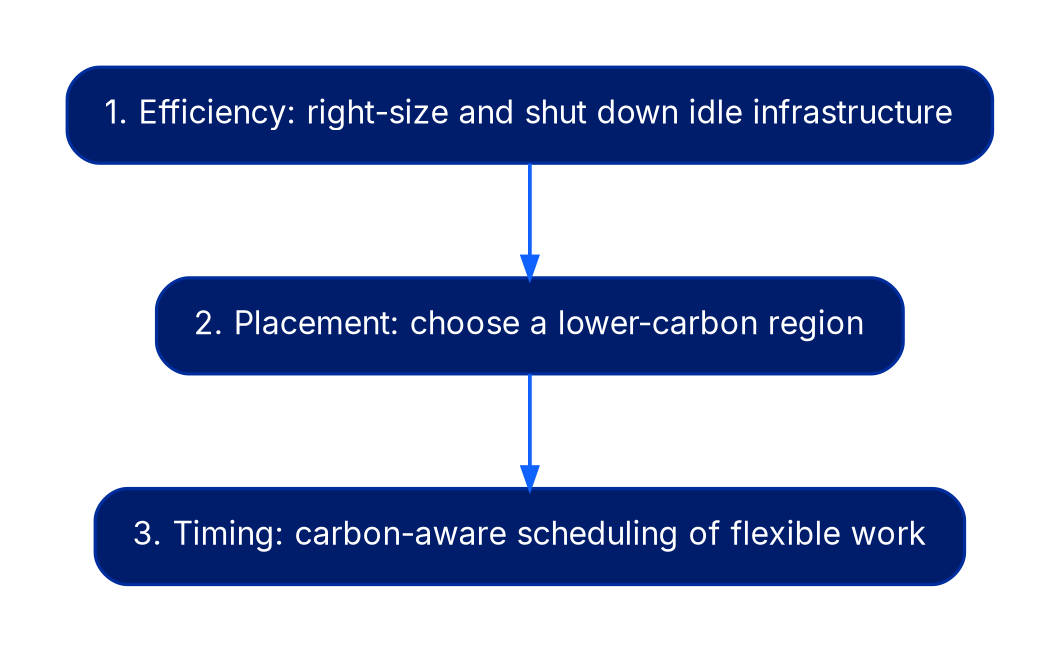
The first is efficiency. Idle and oversized infrastructure burns energy for nothing. An instance running at 5 percent utilization emits almost as much as one running at 60 percent, so right-sizing and shutting down idle non-production environments cuts carbon and spend in the same motion. We routinely see 20 to 40 percent of compute in a mid-market estate sitting in this category before anyone looks.
The second is placement. Region selection changes the location-based footprint by the same order of magnitude that grid intensity varies, which can be more than 10x. Most teams pick a region for latency and habit, never for carbon, and never revisit it. A latency-tolerant batch pipeline that runs in a 500-gram region when a 50-gram region is one config change away is leaving a large, free reduction on the table.
The third is timing. Carbon-aware scheduling shifts flexible work to the hours when the local grid is cleanest, because grid intensity swings through the day as solar rises and falls and as gas peakers come on and off. The window for a deferrable training job or a nightly ETL run is exactly the kind of workload that can chase clean energy without anyone noticing. Marginal grid intensity, not average, is what these decisions should track, because what matters is the emissions caused by your incremental demand.
None of these three needs a new platform purchase. They need a model that makes the carbon visible at the resource level and an owner with the mandate to act on it.
Where carbon accounting and cost discipline converge
The most useful framing we give clients is that cloud carbon accounting and cloud cost discipline are the same engagement wearing two hats. The waste that inflates the bill is, almost line for line, the waste that inflates the footprint. Idle instances, forgotten volumes, overprovisioned databases, and chatty cross-region traffic show up on both ledgers.
This convergence is the reason a carbon program should report into the same function that owns cloud cost, usually platform or infrastructure engineering, with the sustainability team providing the disclosure framing. We have watched the alternative fail repeatedly: a sustainability office that owns the carbon number but cannot change a single instance type produces reports, not reductions. The team that can terminate an idle fleet is the team that should own the carbon metric, expressed as emissions per unit of useful work so it sits next to cost per transaction on the same dashboard.
A caution worth stating plainly. Carbon-aware placement and timing are powerful, but they are bounded by your real latency, data-residency, and reliability constraints. A payments workload bound by regulation to a specific region does not get to chase a cleaner grid, and pretending otherwise produces a number that looks good and an architecture that does not work. The honest model marks those workloads as fixed and finds the savings in the flexible remainder.
What to do in the next two quarters
The work is tractable and it sequences cleanly. Start here.
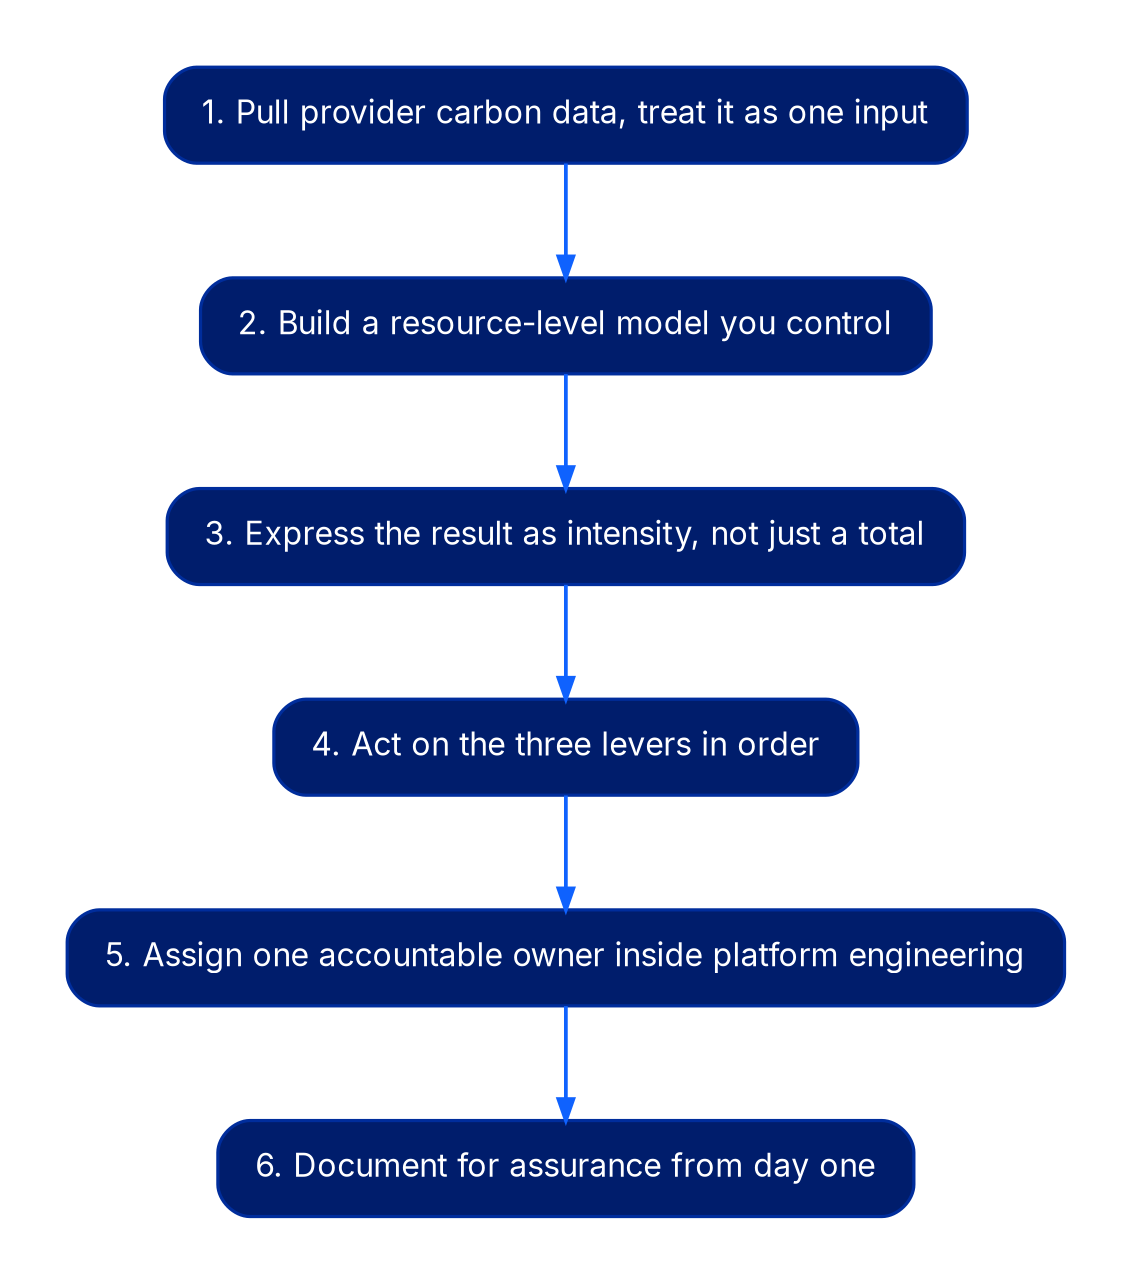
- Pull the provider carbon data, then set it aside as one input. Export the location-based and market-based figures from your hyperscaler tool, note the lag and the method, and resist the urge to file the market-based number on its own.
- Build a resource-level model you control. Join hourly billing and usage data to public grid carbon intensity by region, fix your method against the GHG Protocol Scope 3 standard, and reconcile it against the provider total so you can explain the gap.
- Express the result as intensity, not just a total. Adopt the Software Carbon Intensity method so the metric is emissions per unit of useful work, which is the form engineers can actually reduce.
- Act on the three levers in order. Take the efficiency wins first because they cut cost and carbon together, then revisit region placement for latency-tolerant workloads, then add carbon-aware timing for the deferrable jobs.
- Assign one accountable owner inside platform engineering. Put the carbon intensity metric on the same operating review as cost per transaction and reliability, and give that owner the mandate to enforce changes.
- Document for assurance from day one. Write down boundaries, sources, and assumptions as you build, because the disclosure that survives audit is the one whose every number traces to a sentence you can defend.
The companies that get this right will not be the ones with the prettiest dashboard. They will be the ones who treated cloud carbon as an engineering problem with a reporting obligation attached, owned the math, and moved the number on purpose.
Continue reading
Multi-Cloud Disaster Recovery Architecture: When the Second Cloud Earns Its Keep
Nearly every regulated enterprise now carries a multi-cloud disaster recovery line in its resilience plan. Far fewer have ever failed a production wor…
Kubernetes vs. ECS: A decision framework that actually holds up in production
Most engineering teams treat the Kubernetes vs. ECS question as a technical puzzle. Architecture blog posts compare control planes, IAM integrations, …
AWS to Azure Migration Cost Benchmarks: What the Numbers Actually Show
Most AWS-to-Azure migration budgets are wrong before the project starts. Not because the engineers are bad at their jobs. They are wrong because the c…